


Direct answer: Q4 inventory planning is one calculation repeated per SKU: how many days of cover you have, how fast that cover burns once demand lifts, and whether a reorder placed today lands before the burn empties you.
The model below has five columns and needs no software.
The four dates that decide it: your last safe reorder, your last safe shipment, your restock-limit review, and the cutoff after which new stock cannot matter for December.
Most Q4 inventory advice is a list of reminders. This is the arithmetic underneath it, which you can run in a spreadsheet in twenty minutes.
The model, in five columns
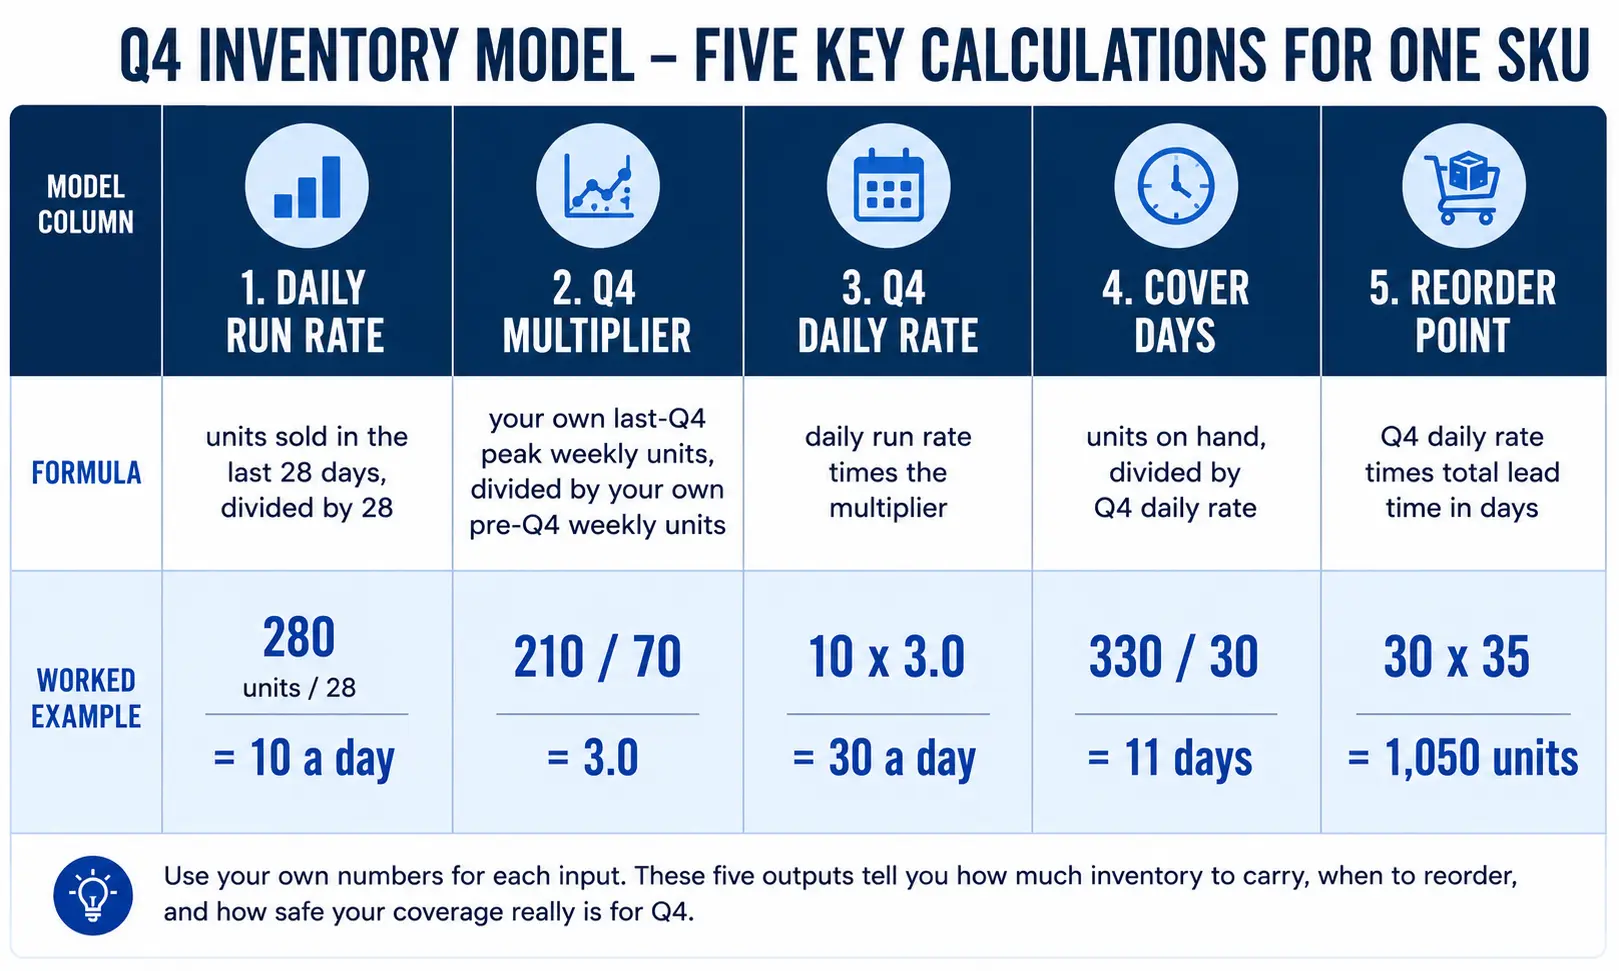
One row per SKU. Five columns. That is the whole model.
| Column | Formula | Worked example |
|---|---|---|
| Daily run rate | units sold in the last 28 days, divided by 28 | 280 units / 28 = 10 a day |
| Q4 multiplier | your own last-Q4 peak weekly units, divided by your own pre-Q4 weekly units | 210 / 70 = 3.0 |
| Q4 daily rate | daily run rate times the multiplier | 10 x 3.0 = 30 a day |
| Cover days | units on hand, divided by Q4 daily rate | 330 / 30 = 11 days |
| Reorder point | Q4 daily rate times total lead time in days | 30 x 35 = 1,050 units |
The multiplier has to be yours. A category average will be wrong for your catalogue in both directions, and the whole model hangs off it. If you sold through last Q4, use last Q4. If you did not, use the highest four-week period you have and say out loud that it is a floor.
Cover days, and why 30 is the wrong number in Q4
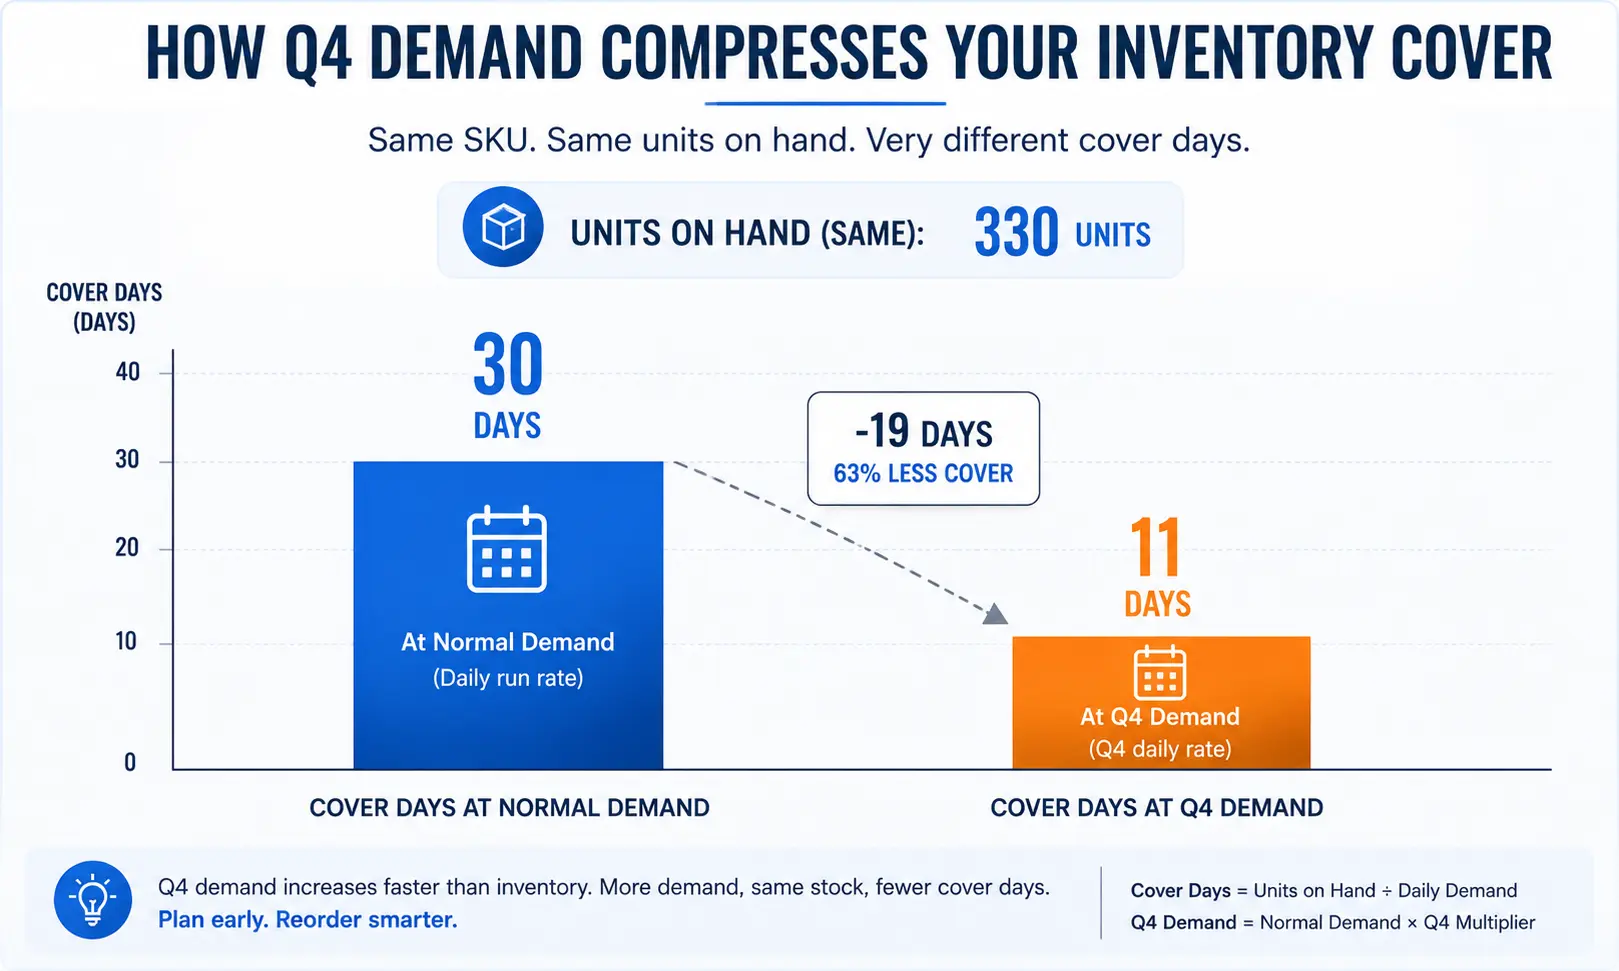
This is the part that catches experienced sellers.
330 units at 10 a day is 33 days of cover. Comfortable. The same 330 units at 30 a day is 11 days. That is not comfortable, and nothing about the inventory changed.
Cover days is not a property of your stock. It is a property of your stock divided by demand, and in Q4 the denominator moves before you notice.
Recalculate cover days weekly from mid-September, using the Q4 daily rate rather than the trailing one. A number you calculated in August is describing a season that has not started.
The four dates that decide December
Work backwards from when stock has to be sellable, not from when you want to order.
| # | The date | How to set it |
|---|---|---|
| 1 | Last safe reorder | Count back from your sell-out date by supplier lead time plus freight plus receiving. This is the last day an order can still arrive in time |
| 2 | Last safe shipment | The date a shipment must leave you to be checked in and sellable. Receiving times stretch in Q4, so use your worst observed check-in time from last year, not your average |
| 3 | Restock-limit review | Amazon states that restock limits determine how much you can ship in, and that exceeding them can raise storage costs. Limits are recalculated periodically and tighten when demand is high. Check yours before you commit to a purchase order, not after |
| 4 | The cutoff | The date after which new stock cannot sell in volume before the season ends. Anything landing after this is January inventory bought at Q4 prices |
Date 4 is the one people skip, and it is the expensive one. Stock that lands too late does not just fail to sell. It carries Q4 storage costs, and it becomes the long-term storage problem you deal with in February.
Three things the model tells you that a reminder list cannot
- Which SKUs are actually at risk. Sort by cover days ascending. The top of that list is your entire Q4 inventory problem, and it is usually four or five SKUs, not the catalogue
- How much to order, not just when. Reorder point minus units on hand, plus whatever you want as buffer. That is a number, not a judgment
- Which SKUs to stop advertising. If cover days is under lead time, more traffic just brings the stockout forward. Cutting spend on those is often the highest-value thing you do in October
What the model does not do
It does not forecast demand. It projects your own history forward with a multiplier you chose, which is a different and more honest thing.
It will be wrong if a product goes viral, if a competitor goes out of stock and their demand lands on you, or if your multiplier came from a season that was not representative.
Rerun it weekly rather than trusting it monthly. The model is cheap to run, which is the point of keeping it to five columns.
If your catalogue is large enough that per-SKU modelling stops being realistic in a spreadsheet, that is usually the point where wholesale FBA management starts paying for itself. Sellers running the same model across several channels usually consolidate it into eCommerce management services. Our guide to inventory management software covers the tooling side, and if you run this model across Walmart as well as Amazon, the arithmetic is identical per channel.
The free template
Build it in ten minutes, or copy the structure below into a sheet.
Columns, left to right:
- SKU
- Units on hand
- Units sold, last 28 days
- Daily run rate = C / 28
- Q4 multiplier (yours, entered manually)
- Q4 daily rate = D * E
- Cover days = B / F
- Lead time, days (yours, entered manually)
- Reorder point = F * H
- Order now? = IF(B < I, “YES”, “no”)
- Last safe reorder date
- Notes
Sort by column 7 ascending. Everything above your lead time is fine. Everything below it is the list.
Frequently Asked Questions
Enough that cover days stays above your total lead time through the peak. Calculate it as Q4 daily rate times lead time, then add whatever buffer your cash position allows. There is no universal number, because it depends entirely on your own lead time and your own seasonal multiplier.
Work backwards from your sell-out date rather than forwards from today. Take supplier lead time, add freight, add receiving time, and use your worst observed receiving time from last year rather than your average, because check-in slows under Q4 volume.
Use your own, not a category average. Divide your peak weekly units last Q4 by your normal pre-Q4 weekly units. If you have no last Q4, use the strongest four-week period you do have and treat the result as a floor.
If cover days is below your lead time, more traffic only brings the stockout forward and risks the ranking you built. Reducing spend on those SKUs and moving it to well-stocked ones is usually the highest-value change available in October.
Where That Leaves You
Q4 inventory isn’t a planning problem, it’s a division problem, run weekly, on the four or five SKUs that actually matter. Twenty minutes in a spreadsheet now is worth more than any amount of reacting in November. Our Amazon FBA management team starts every new account with a free 48-hour audit.